Everything you may not have wanted to know about the Messervys
My genealogy software, MAC Family Tree, has a lot of bells and whistles including the capacity to produce statistical reports from the data in a particular tree. Of course, as with any software it is only as good as the data that is input. As my website data is a work in progress, there are some empty spots in the data. Thus,for those of you who are excited by statistics and patterns in data, what follows are some select charts. Enjoy or not.....
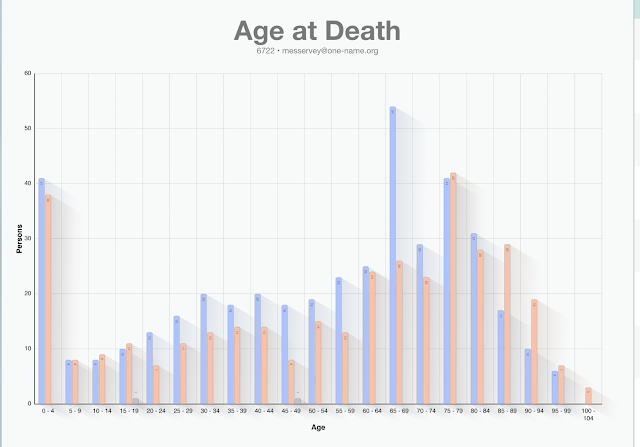

Colours are traditional pink for women and blue for men (default). Some observations based on my familiarity with the Messervy content:
· The spike for children 0 – 4 years of age likely reflects that most information is from times past when infants and toddlers were subject to a range of challenges to survival. In particular, the Messervys in Jersey go back to 1400s and earlier when families endured the deaths of many of their children.
· Another spike is males in the age range 65 – 69. Throughout the eras of family history collected, many men died in this range and many women outlived them. Note that by age 75 – 79, there is a balance.
· By the age group 85 – 99, the death of women becomes greater than for men. The observation is an obvious one here as there are far more women alive at this age, in order to die! There are no males over 100 with a death date.

Keep in mind that this data includes second and beyond marriages and will have an influence on the older age of marriage. Observations include:
· Far more females were married between the age of 15-19 years, reflecting earlier times when 15/16 years was considered a suitable time for marriage of girls.
· In the years 20 – 24, there was a balance between males and females and this appears to be the most popular time for marriage.
· One can assume that in the ages 25 – 35, where the total number of marriages drops, the women are noticeably lower, perhaps having been married off at 18!

Note that this is not data on birth of first child only, but all children. This graph, in general, reinforces the difference between age of wives and husbands. Men can of course continue to be fathers but birth for women is age-related. Also keep in mind that childbirth was a risky endeavour in early years, with many women dying. Men would marry a second or third time to a wife who was young enough to give birth.

What does this tell us? Not that much that we don’t already know. In the early years we see more males than females but that, in my humble opinion, suggests that males were more written about or it was easier to find their birth dates. While obviously the growth of population emerged through the 1800s plus, it is also easier to find the birth information for people born in these years. On the end of the spectrum, numbers decrease again for similar
lack of information for living people due to privacy, and the general trend to fewer births. It’s all there in the Messervy worldwide family!

Were there June brides throughout history? Numbers correspond to months, that is, January is 1 and December is 12. June is month #6 and while there is a slight spike, it is not a noticeable trend. What is noticeable are the months not popular: February, March, and August. Much of this data is dependent on where the people were living (weather); what seasonal aspects to their livelihoods (farmers, fishers, etc.) and require data that is more refined.


Very interesting
ReplyDelete